


This is the first edition of Charts to Understand AI, a monthly collection from Alephic. These six charts cover AI capacity, spending, work, and the history of electrification.
Explore the full collection of 39 charts at our website , with chapter navigation and full-size views.
Capacity & cost
The supply of AI compute keeps expanding
Epoch estimates quarterly AI chip capacity sold rose from 0.8 million to 6.3 million H100-equivalents between Q1 2024 and Q2 2026.
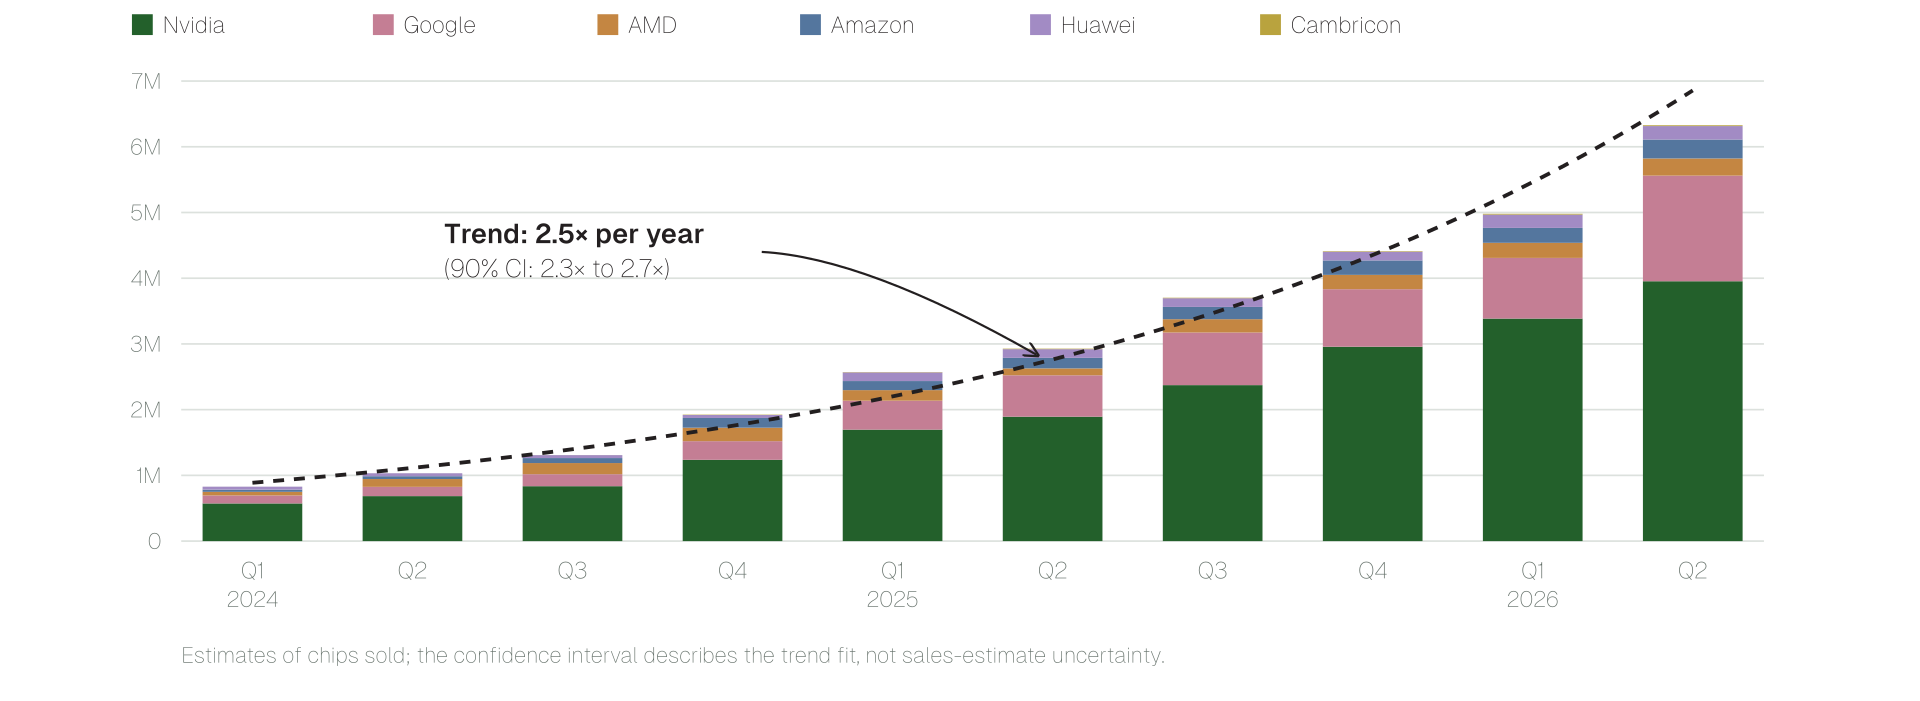
Q1 2024–Q2 2026; published October 29, 2026 · Epoch AI · Isabel Juniewicz and Josh You
Spending & deployment
AI spending describes very different kinds of companies
Monthly AI spending per employee across Ramp businesses, from the median to the highest-spending cohorts.
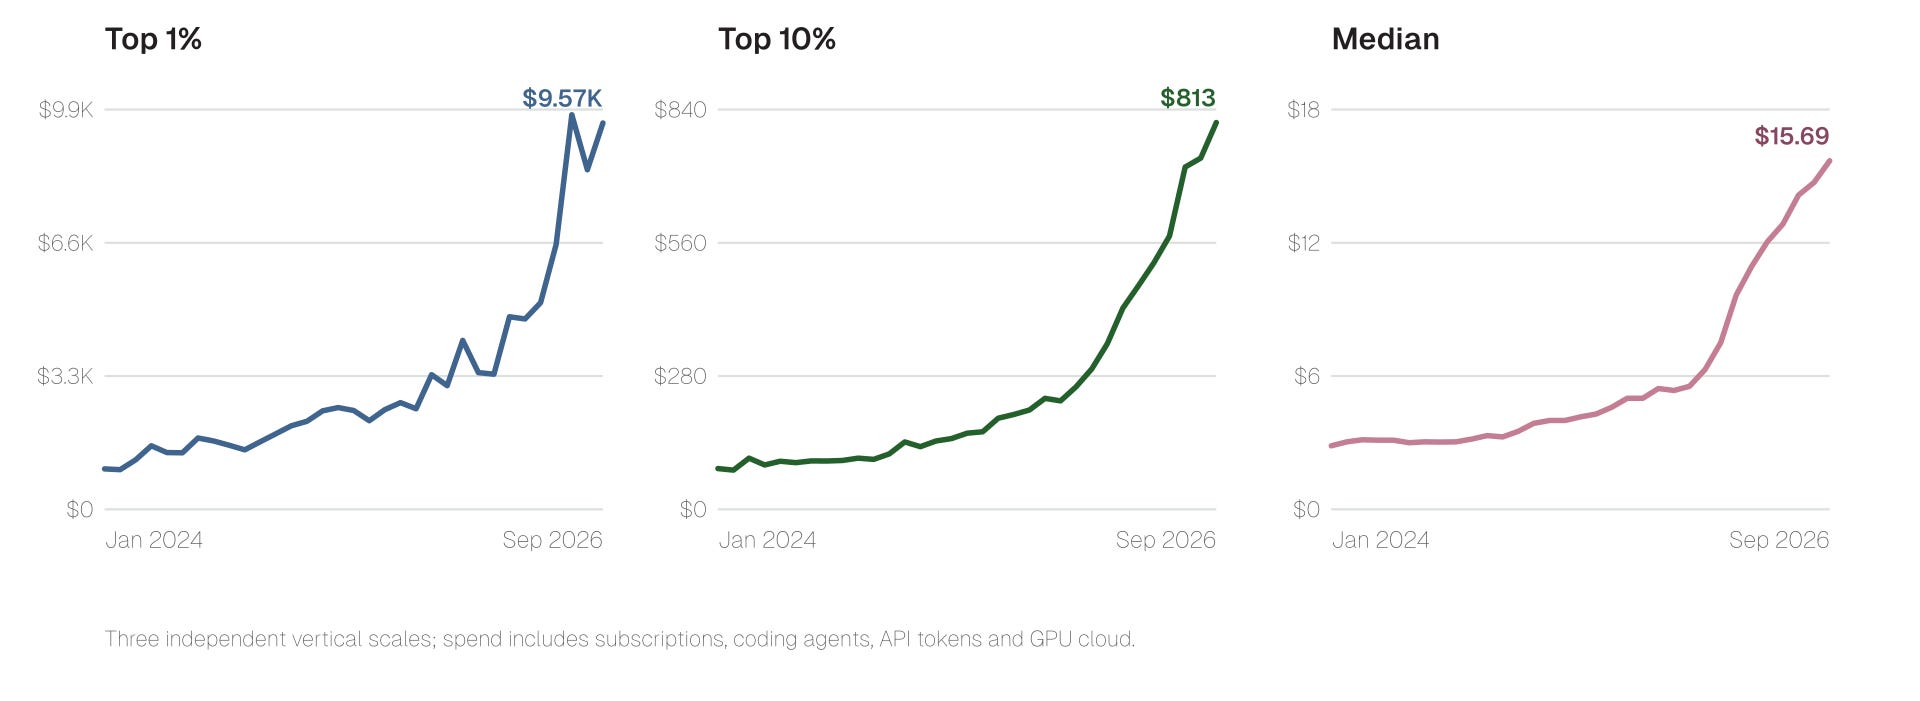
Monthly spending through September 2026 · Ramp Economics Lab · Ara Kharazian
Use & value
Individual gains and company results are different measures
McKinsey respondents report personal productivity gains (80%) more often than enterprise EBIT impact (37%).
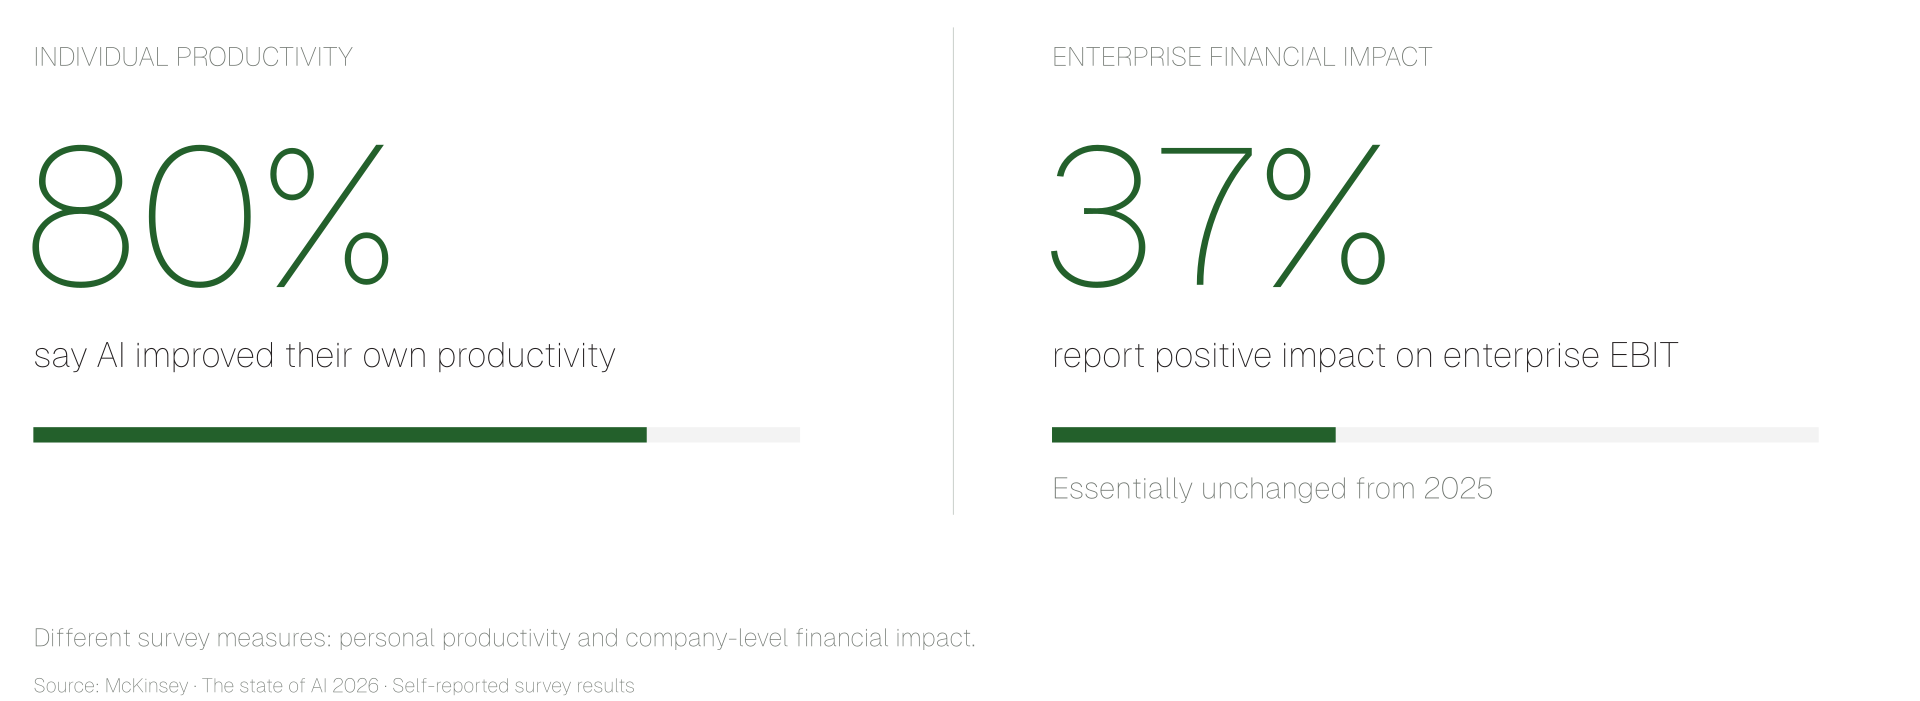
Survey May 4–June 8, 2026 · McKinsey · The state of AI in 2026
Changing the work
Output and headcount can move apart
Output and employment across sectors in the US, UK, and Eurozone; the US technology panel shows output rising as employment declines.
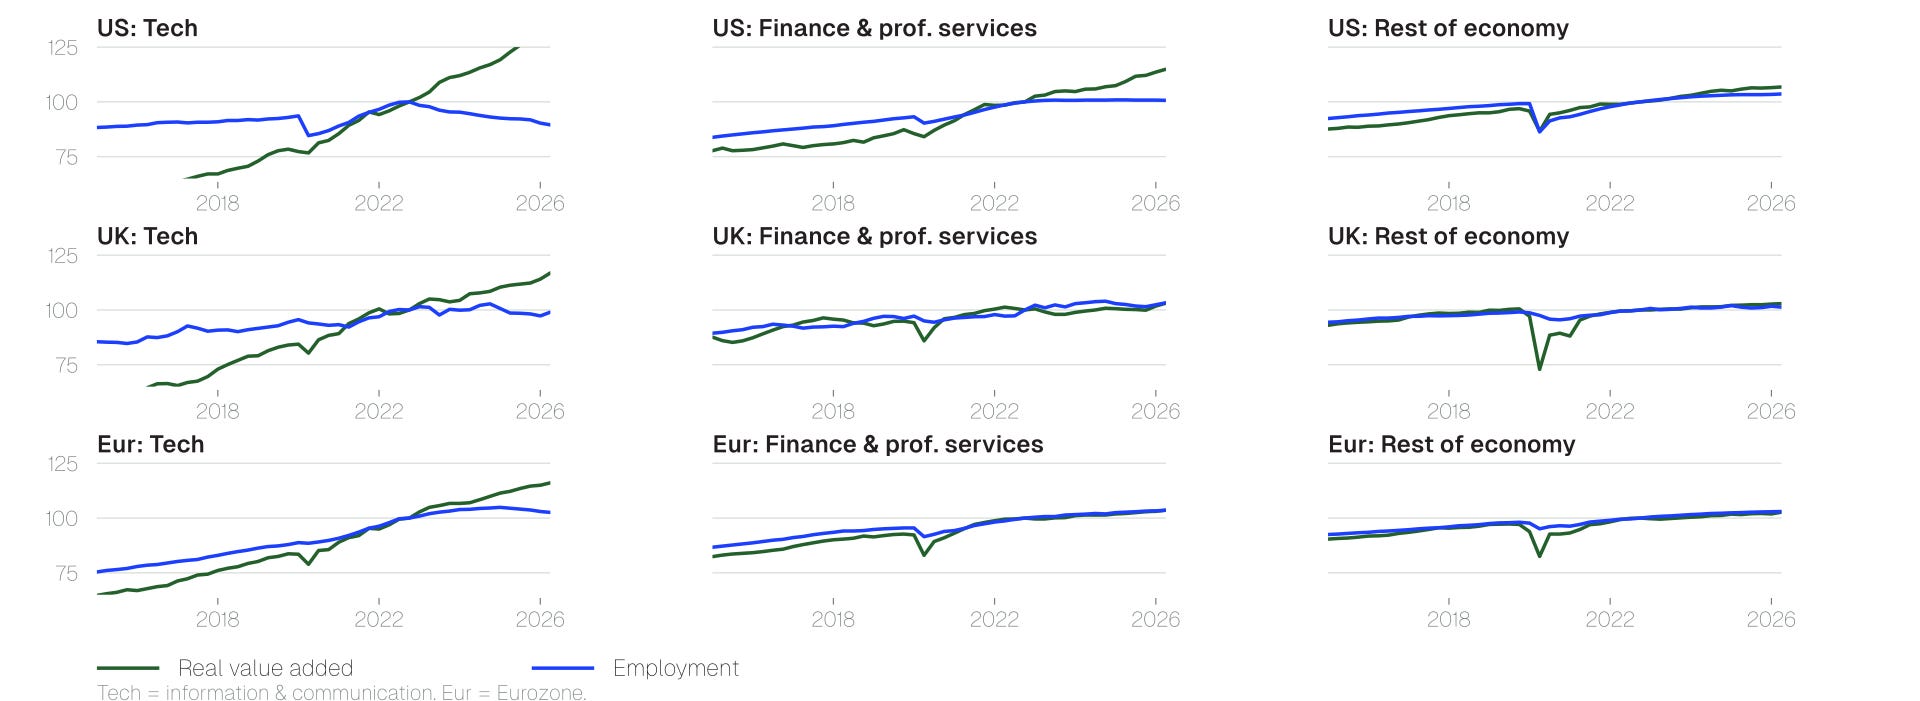
Published October 31, 2026; source series indexed to Q4 2022 · Financial Times · John Burn-Murdoch
History
Electricity took decades to spread
Electricity’s share of machinery-driving capacity in US manufacturing, 1869–1939.
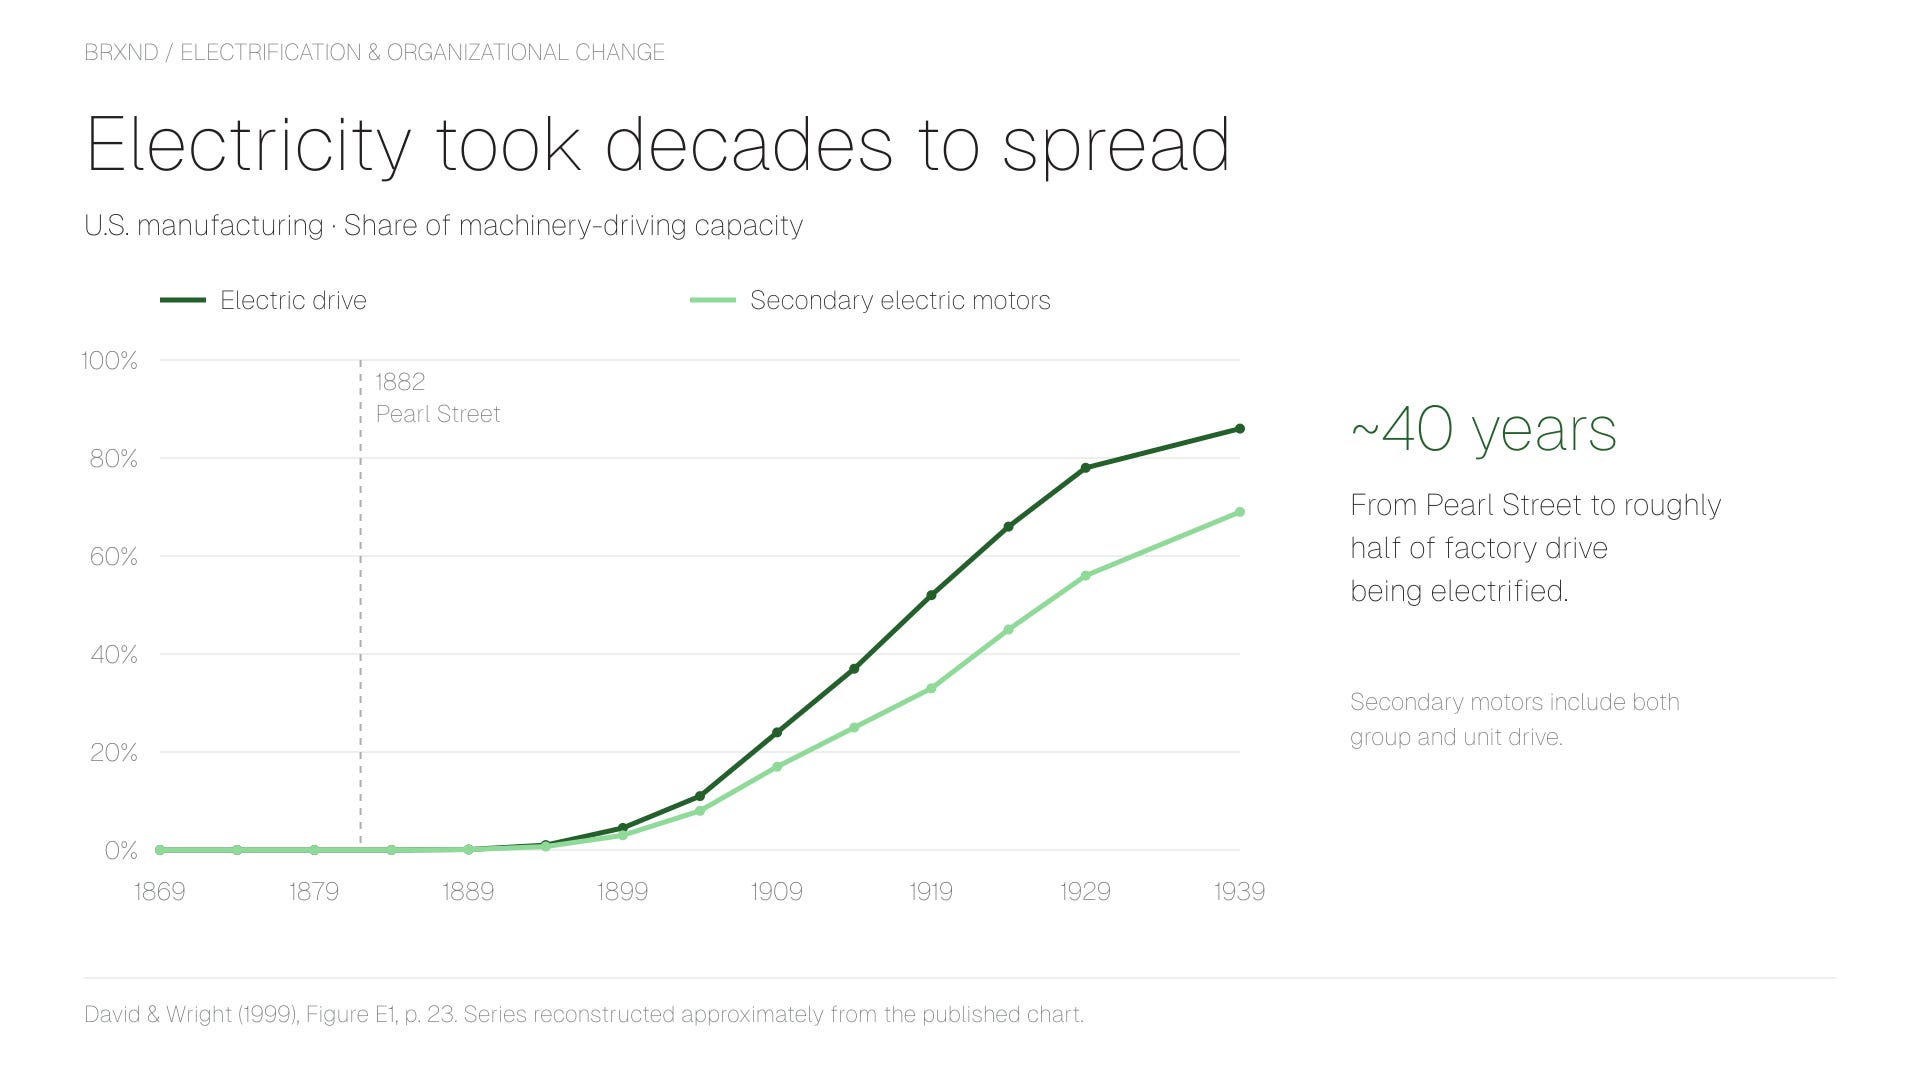
1869–1939 · David & Wright (1999), Figure E1, p. 23.
Then productivity changed pace
US manufacturing output per hour, indexed to 1899.
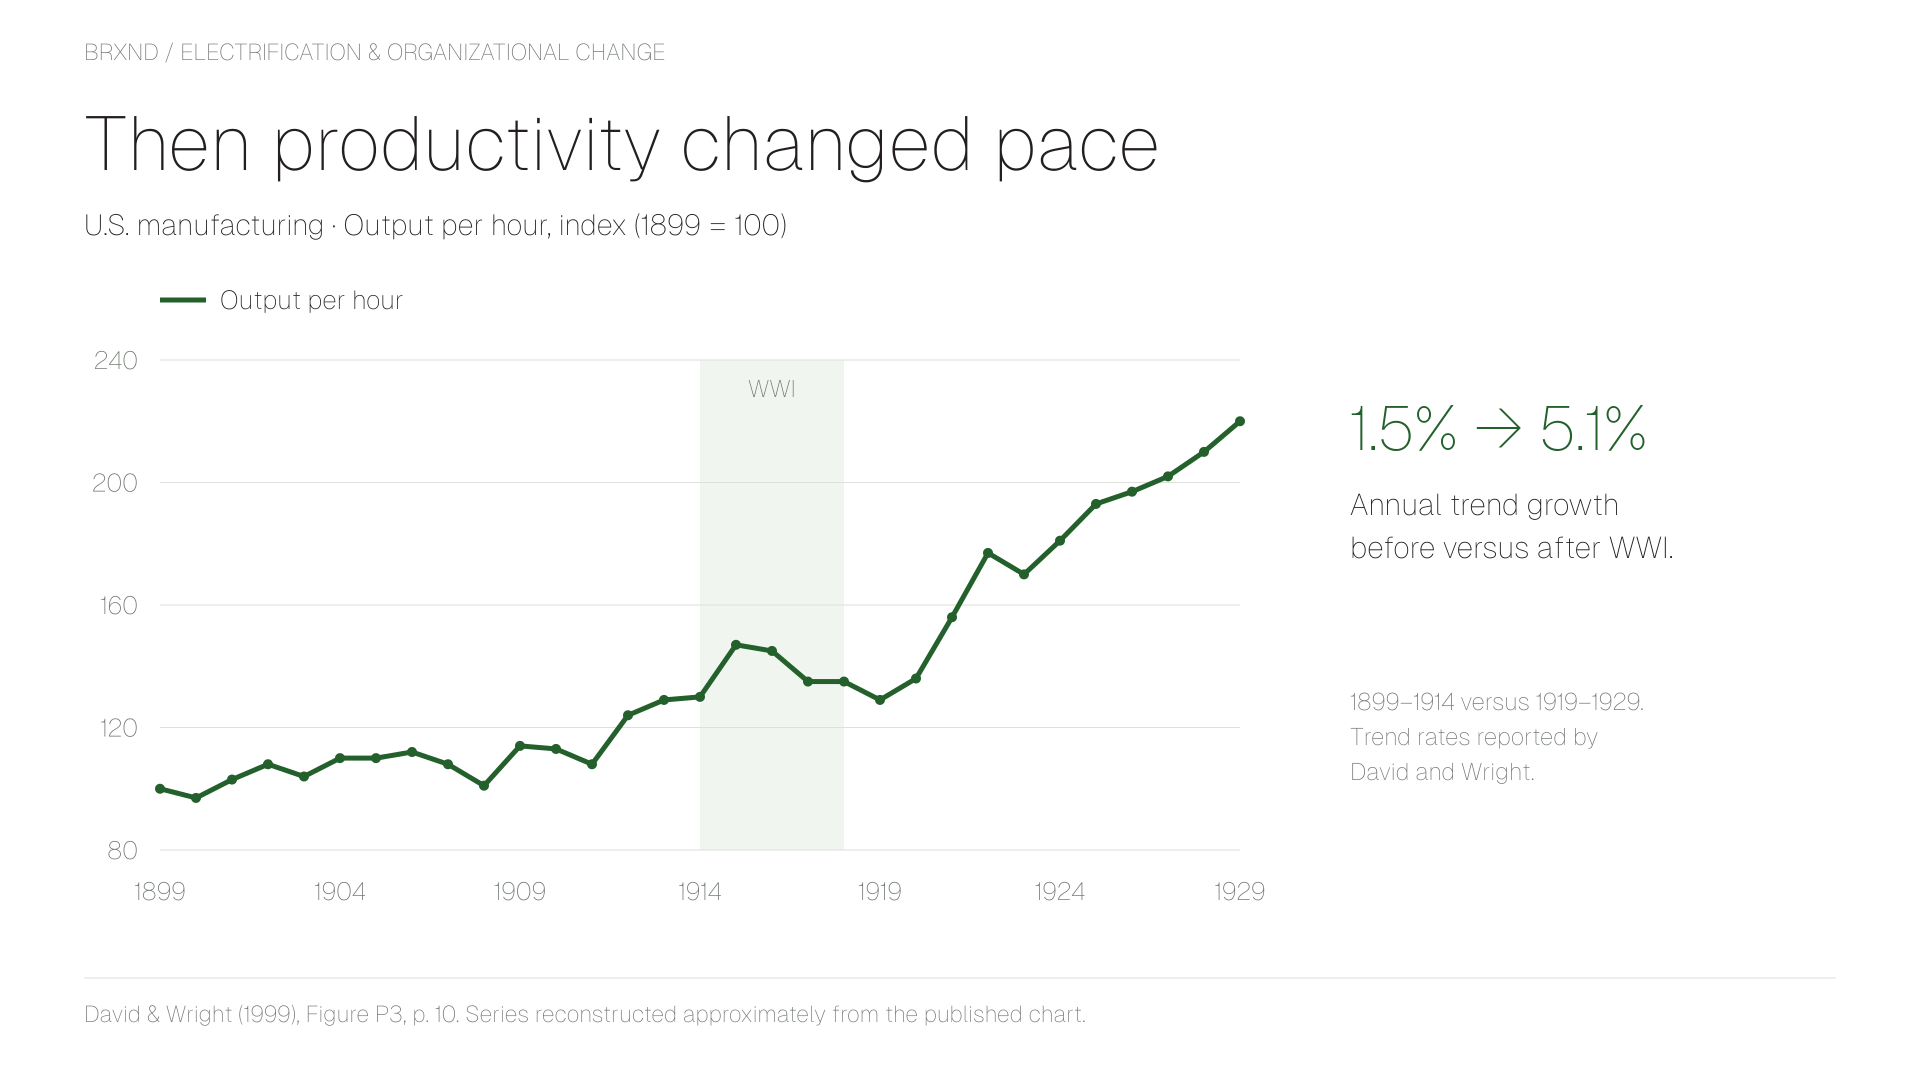
1899–1929 · David & Wright (1999), Figure P3, p. 10.